3. Four main reasons causing macro data
underestimated
3.1 The practice of PPP projects
accelerating and growth rate of private investment falling
Since this year, the scale of PPP project
keeps expanding, yet accordingly the growth rate of private investment drops
evidently, with down to -1.2% in July, which is related to adjustment of
principal part of statistic caused by private investment going to PPP projects.
The scale of PPP is huge and its projects
speed up. There are 1,331 projects in two batches of PPP projects offered by
the National Development and Reform Commission, accounting for RMB3.5 trillion
of investment. Besides, 9,285 PPP projects provided by the Ministry of Finance
involve RMB10.6 trillion of investment. And the huge amount of investment
pushes up the constant rise of practice rate, with 35.1% in March going up to
48.4% in June.
The figure of private investment growth was
statistically lowered due to PPP projects which attract widely social capitals,
including private enterprises, state-owned enterprises and mixed ownership
enterprises. Among them, the private investment entering to the PPP projects
wasn’t counted into the statistical data. In H1 2016, the actual investment of
PPP projects reached to about RMB1.2 trillion, among which the investment of
private enterprises occupied 12%, the investment of mixed ownership enterprises
made up 51% (including state-owned enterprise + private enterprise, state-owned
enterprise + foreign enterprise, private enterprise + foreign enterprise). And
it’s anticipated that the total investment of private enterprises accounted for
45% to 50%. The construction cycle of capital investment usually lasts
relatively longer years, thus we correct the estimation by two terms of project
implementation---5 years and 10 years. After revised estimation, the data of
private investment growth in H1 2016 appeared to be 3.52%-3.60% and
3.17%-3.21%, respectively, which is obviously different from 2.82% released as
actual growth rate.
PPP projects lowering the growth rate of private
investment
|
The period of project implementation
|
The private investment of PPP in H1 2016
( billion RMB)
|
The private investment in H1
2016(trillion RMB)
|
The private investment in H1 2015(trillion
RMB)
|
The revised growth rate of private
investment in H1 2016
|
The actual growth rate
|
|
5 years
|
108-120
|
15.8797
|
15.4438
|
3.52-3.60%
|
2.82%
|
|
10 years
|
54-60
|
3.17-3.21%
|
Source:
Ministry of Finance, National Development and Reform Commission, Founder
Securities
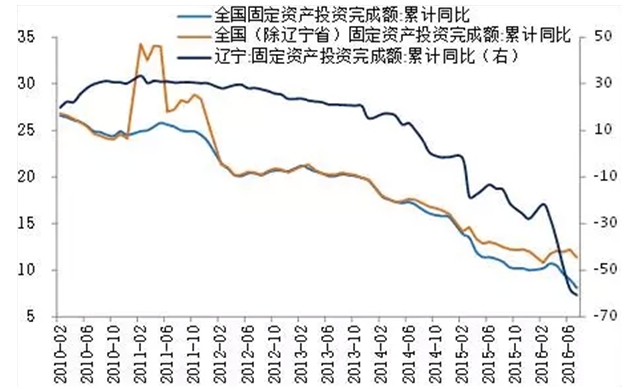
3.2 Liaoning province squeezing the false
statistic, lowering state growth rate of fixed-asset investment
The growth rate of social fixed-asset
investment falls remarkably in 2016, with the accumulative growth rate up by
8.1% YoY in the first 7 months this year, 0.9 percentage point lower than that
in H1 2016, and the growth rate in July up by 3.9% YoY,3.5 percentage points
lower than that in June.
To some extent, current data of fixed-asset
investment is disturbed by the statistics made by some local governments, such
as Liaoning province.
Since the financial crisis in 2008, Liaoning’s
fixed-asset investment growth rate even reached to 60% at one point. However,
this data began to fall sharply after the inspection team from central
government, in 2015, found that the three provinces in northeast China (Liaoning
province, Jilin province and Heilongjiang province) made some tricks on
statistics. This July, the accumulative growth rate of fixed-asset investment
in Liaoning province was -60.70% YoY, 2.6 percentage points lower than that in
June.
Stripping out the effect of Liaoning
province, there are signs of stability for the fixed-asset investment data this
year under the drive of real estate industry and PPP projects. The growth rate
of nationwide fixed-asset investment in Q2 2016 (removing the effect of
Liaoning province) appeared to be stable, with accumulative growth rate YoY in
the first half of 2016 going to 12.20%, 0.13 percentage point more than that in
the first 4 months. If Liaoning province is calculated, that figure in June
would be 1.5 percentage points lower than that in April, showing a relatively
high fluctuation in Q2.
Except Liaoning province, the growth rate
of fixed-asset investment in other provinces this year gets rebound to some
extent due to the stimulation of fiscal policy. From Feb. to July in 2016, the
growth rate of nationwide fixed-asset investment declined by 2.1 percentage
points, while that in Liaoning province was as highly as 39 percentage points.
In the same period, that figure was up by 2.1 percentage points in Chongqing,
up by 0.9 percentage point in Guangdong province, and down by 0.1, 0.2 and 0.6
percentage point in Shandong province, Hubei province and Jiangxi province,
respectively, all of which are better than the average state level in growth
rate. This, again, proves the stable performance of nationwide fixed-asset
investment recently, after eliminating the effect of Liaoning province.
Negative growth of statistic in
Liaoning province, lowering state growth rate of fixed-asset investment

Nationwide fixed-asset investment:
accumulative comparison YoY
Nationwide (except
Liaoning province) fixed-asset investment: accumulative comparison YoY
Liaoning: fixed-asset investment:
accumulative comparison YoY (on the right)
Source: Wind, Founder Securities
3.3 Local
government bonds issued to replace outstanding debt putting down the data of
medium and long term loans for enterprises
Local government bonds issued to replace
outstanding debt lower the data of medium and long term loans for enterprises.
In July, new loan increment of RMB reached to RMB463.6 billion, RMB1.01
trillion less increase YoY. The finance credit is totally supported by
individual housing loans, with the loans for household sector increased by
RMB457.5 billion, that for non-financial enterprises and government
organizations decreased by RMB2.6 billion.
According to the budget report of ministry
of finance, the local government bonds issued to replace outstanding debts due
in 2016 reach about RMB5 trillion, much more than RMB3.8 trillion in 2015. Data
from ministry of finance showed that up to the end of July, the local
government bonds issued this year was RMB3.971 trillion, with new bonds
RMB1.0084 trillion and replacement bonds RMB2.9626 trillion. What’s more, the
majority of local government replacement bonds were replaced by enterprises’
medium and long term loans, which made the data of enterprises’ medium and long
term loans this year distorted and underestimated.
3.4 Consumption in emerging industries exuberating
and there are many missing points in statistic
As the increase of per capita income,
resident consumption structure keeps advancing. H1 2016 witnessed the
continuous progress in such industries as tourism, aviation, entertainment and
healthcare, though the whole economy went downward. Notably, the fixed-asset
investment of aviation industry enjoyed a rapid growth against the overall
trend. However, as these industries just occupy a small proportion of GDP and
the statistic approach for service sector is not as good as that for
manufacture sector, there exists many missing data in service sector.
Though affected by the downward economy and
depreciation of RMB, China’s tourism stayed a favorable growth in H1 2016, with
the number of accumulative domestic tour people up by 10.47% YoY, that of accumulative
inbound tour people up by 3.8% YoY, and that of accumulative outbound tour
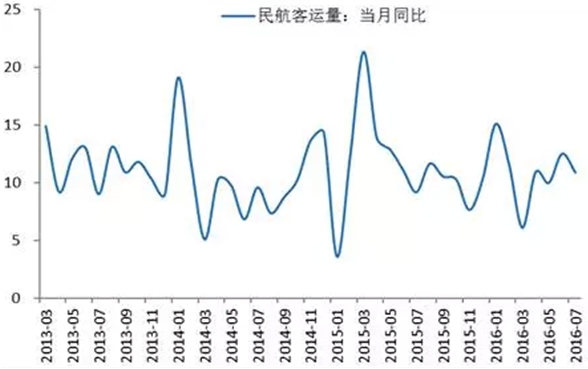
people up by 4.3% YoY. Driven by tourism industry, the volume of passengers
transport through civil aviation kept high growth, with the growth rate going
up by more than 10% YoY since April.
Tourism industry keeping positive growth
Source: National Tourism Administration,
Founder Securities
Volume of passengers transport
through civil aviation keeping high growth
(%)

The volume of passengers transport
through civil aviation, monthly figure YoY
Source: Wind, Founder Securities
4. Conclusion: the economy situation
appearing to be L-shape, and 5% of growth currently better than 8% of growth in
the past
1) The real situation of economy appears to
be L-shape.
2) Several proofs for L-shape economy
3) Four major reasons that cause the macro
data underestimated
4) L-shape economy makes big influences on
stock market, bond market and the commodity price.
5) The government carried out a neutral and
prudent monetary policy recently due to sharp rise of real estate prices,
de-leverage plan and expectation of raising interest rate by FED.
6) Potential risk: The expectation of
raising interest rate by FED is more possible, causing the depreciation of
exchange rate, the pressure of capital outflow, and the impact on China’s
financial market, particularly, on the real estate industry. And the minor
cycle of real estate rise may go to the end due to the policy for restraining
asset price bubble as well as the completion of release of stage demand. Besides,
the price rebound of coal, iron and steel may bring about the recovery
production, thus changing the relation between supply and demand. What’s more,
a new round of clearance and regulation might be introduced as PPP get out of
control.
*The
article is edited and translated by CCM. The original one comes from Laohucaijing.com.
About CCM:
CCM is the leading market intelligence
provider for China’s agriculture, chemicals, food & ingredients and life
science markets. Founded in 2001, CCM offers a range of data and content solutions, from price
and trade data to industry newsletters and customized market research reports. Our clients include Monsanto, DuPont, Shell, Bayer, and Syngenta. CCM is a
brand of Kcomber Inc.
For
more information about CCM, please visit www.cnchemicals.com or
get in touch with us directly by emailing econtact@cnchemicals.com or
calling +86-20-37616606.